
Die Anvil's Storage Utilities sind kostenlos erhältlich und eignen sich sowohl für Benchmarks auf modernen SSDs als auch auf herkömmlichen magnetischen Speichern (HDDs). Die Freeware misst nicht nur die Lese- und Schreibtransferraten in bis zu sechs verschiedenen Clustergrößen, sondern auch die Anzahl der Ein- und Ausgabebefehle, die das Laufwerk pro Sekunde abarbeiten kann (IOPS). Für unsere Tests haben wir die sequentiellen Datenraten sowie IOPS ermittelt. Zudem mussten die Testprobanden bei kleineren 4K-Blöcken und bei erweiterter Anfragetiefe (QD16) ihr Können unter Beweis stellen.
| Transferrate, Lesen, Mittelwert | |
| Intel SSD 750 Series, 1.2 TB (PCIe 3.0 x4) | 2.151,26 |
| Kingston HyperX Predator, 480 GB (PCIe 2.0 x4) | 1.287,24 |
| Plextor M6e Black, 256 GB (PCIe 2.0 x2) | 721,13 |
| OCZ TR150, 480 GB | 531,53 |
| Plextor M6V, 256 GB | 529,34 |
| OCZ Trion 100, 960 GB | 527,29 |
| OCZ Vector 180, 240 GB | 527,21 |
| ZOTAC Premium SSD, 240 GB | 527,16 |
| Plextor M7V, 256 GB | 527,16 |
| Toshiba Q300, 240 GB | 525,13 |
| Kingston HyperX Savage SSD, 480 GB | 525,13 |
| Toshiba Q300 Pro, 256 GB | 520,99 |
| Toshiba Q300 Pro, 128 GB | 520,99 |
| Toshiba Q-Series Pro, 256 GB | 520,99 |
| Angaben in MB/sec (mehr ist besser) | |
| Transferrate, Schreiben, Mittelwert | |
| Intel SSD 750 Series, 1.2 TB (PCIe 3.0 x4) | 1.216,15 |
| Kingston HyperX Predator, 480 GB (PCIe 2.0 x4) | 585,81 |
| Plextor M6e Black, 256 GB (PCIe 2.0 x2) | 551,72 |
| Kingston HyperX Savage SSD, 480 GB | 500,98 |
| OCZ TR150, 480 GB | 497,33 |
| ZOTAC Premium SSD, 240 GB | 497,09 |
| Plextor M7V, 256 GB | 489,95 |
| OCZ Vector 180, 240 GB | 478,95 |
| Toshiba Q-Series Pro, 256 GB | 472,11 |
| Toshiba Q300 Pro, 256 GB | 465,45 |
| Toshiba Q300 Pro, 128 GB | 465,45 |
| OCZ Trion 100, 960 GB | 449,71 |
| Plextor M6V, 256 GB | 341,90 |
| Toshiba Q300, 240 GB | 154,08 |
| Angaben in MB/sec (mehr ist besser) | |
| Zugriffe, Lesen, Mittelwert | |
| Intel SSD 750 Series, 1.2 TB (PCIe 3.0 x4) | 537 |
| Kingston HyperX Predator, 480 GB (PCIe 2.0 x4) | 322 |
| Plextor M6e Black, 256 GB (PCIe 2.0 x2) | 180 |
| OCZ TR150, 480 GB | 133 |
| ZOTAC Premium SSD, 240 GB | 132 |
| Plextor M7V, 256 GB | 132 |
| Plextor M6V, 256 GB | 132 |
| OCZ Trion 100, 960 GB | 132 |
| Toshiba Q300, 240 GB | 131 |
| Kingston HyperX Savage SSD, 480 GB | 131 |
| Toshiba Q300 Pro, 256 GB | 130 |
| Toshiba Q300 Pro, 128 GB | 130 |
| Toshiba Q-Series Pro, 256 GB | 130 |
| OCZ Vector 180, 240 GB | 124 |
| Angaben in IOPS (mehr ist besser) | |
| Zugriffe, Schreiben, Mittelwert | |
| Intel SSD 750 Series, 1.2 TB (PCIe 3.0 x4) | 304 |
| Kingston HyperX Predator, 480 GB (PCIe 2.0 x4) | 147 |
| Plextor M6e Black, 256 GB (PCIe 2.0 x2) | 137 |
| Kingston HyperX Savage SSD, 480 GB | 125 |
| ZOTAC Premium SSD, 240 GB | 124 |
| OCZ TR150, 480 GB | 124 |
| Plextor M7V, 256 GB | 122 |
| OCZ Vector 180, 240 GB | 119 |
| Toshiba Q-Series Pro, 256 GB | 118 |
| Toshiba Q300 Pro, 256 GB | 116 |
| Toshiba Q300 Pro, 128 GB | 116 |
| OCZ Trion 100, 960 GB | 112 |
| Plextor M6V, 256 GB | 86 |
| Toshiba Q300, 240 GB | 38 |
| Angaben in IOPS (mehr ist besser) | |
| Transferrate, Lesen, Mittelwert | |
| Intel SSD 750 Series, 1.2 TB (PCIe 3.0 x4) | 42,96 |
| Plextor M7V, 256 GB | 42,67 |
| ZOTAC Premium SSD, 240 GB | 40,26 |
| OCZ Vector 180, 240 GB | 39,48 |
| Kingston HyperX Predator, 480 GB (PCIe 2.0 x4) | 38,54 |
| Plextor M6V, 256 GB | 38,01 |
| Plextor M6e Black, 256 GB (PCIe 2.0 x2) | 35,68 |
| Kingston HyperX Savage SSD, 480 GB | 34,55 |
| OCZ TR150, 480 GB | 33,89 |
| Toshiba Q300, 240 GB | 33,17 |
| OCZ Trion 100, 960 GB | 33,01 |
| Toshiba Q-Series Pro, 256 GB | 24,89 |
| Toshiba Q300 Pro, 256 GB | 24,84 |
| Toshiba Q300 Pro, 128 GB | 24,05 |
| Angaben in MB/sec (mehr ist besser) | |
| Transferrate, Schreiben, Mittelwert | |
| OCZ Vector 180, 240 GB | 147,38 |
| Toshiba Q300 Pro, 256 GB | 133,97 |
| Plextor M6V, 256 GB | 133,37 |
| Kingston HyperX Savage SSD, 480 GB | 131,42 |
| Toshiba Q300 Pro, 128 GB | 130,71 |
| Toshiba Q-Series Pro, 256 GB | 129,64 |
| ZOTAC Premium SSD, 240 GB | 122,54 |
| OCZ Trion 100, 960 GB | 121,91 |
| OCZ TR150, 480 GB | 114,65 |
| Kingston HyperX Predator, 480 GB (PCIe 2.0 x4) | 108,65 |
| Plextor M6e Black, 256 GB (PCIe 2.0 x2) | 101,46 |
| Plextor M7V, 256 GB | 98,37 |
| Intel SSD 750 Series, 1.2 TB (PCIe 3.0 x4) | 95,37 |
| Toshiba Q300, 240 GB | 87,38 |
| Angaben in MB/sec (mehr ist besser) | |
| Zugriffe, Lesen, Mittelwert | |
| Intel SSD 750 Series, 1.2 TB (PCIe 3.0 x4) | 10.997 |
| Plextor M7V, 256 GB | 10.924 |
| ZOTAC Premium SSD, 240 GB | 10.305 |
| Kingston HyperX Predator, 480 GB (PCIe 2.0 x4) | 9.866 |
| Plextor M6V, 256 GB | 9.731 |
| OCZ Vector 180, 240 GB | 9.545 |
| Plextor M6e Black, 256 GB (PCIe 2.0 x2) | 9.134 |
| Kingston HyperX Savage SSD, 480 GB | 8.844 |
| OCZ TR150, 480 GB | 8.674 |
| Toshiba Q300, 240 GB | 8.492 |
| OCZ Trion 100, 960 GB | 8.451 |
| Toshiba Q-Series Pro, 256 GB | 6.373 |
| Toshiba Q300 Pro, 256 GB | 6.359 |
| Toshiba Q300 Pro, 128 GB | 6.158 |
| Angaben in IOPS (mehr ist besser) | |
| Zugriffe, Schreiben, Mittelwert | |
| OCZ Vector 180, 240 GB | 37.728 |
| Toshiba Q300 Pro, 256 GB | 34.296 |
| Plextor M6V, 256 GB | 34.143 |
| Kingston HyperX Savage SSD, 480 GB | 33.642 |
| Toshiba Q300 Pro, 128 GB | 33.461 |
| Toshiba Q-Series Pro, 256 GB | 33.188 |
| ZOTAC Premium SSD, 240 GB | 31.369 |
| OCZ Trion 100, 960 GB | 31.208 |
| OCZ TR150, 480 GB | 29.350 |
| Kingston HyperX Predator, 480 GB (PCIe 2.0 x4) | 27.815 |
| Plextor M6e Black, 256 GB (PCIe 2.0 x2) | 25.973 |
| Plextor M7V, 256 GB | 25.182 |
| Intel SSD 750 Series, 1.2 TB (PCIe 3.0 x4) | 24.415 |
| Toshiba Q300, 240 GB | 22.368 |
| Angaben in IOPS (mehr ist besser) | |
| Transferrate, Lesen, Mittelwert | |
| Intel SSD 750 Series, 1.2 TB (PCIe 3.0 x4) | 577,00 |
| OCZ Vector 180, 240 GB | 349,81 |
| ZOTAC Premium SSD, 240 GB | 344,38 |
| Plextor M6e Black, 256 GB (PCIe 2.0 x2) | 314,18 |
| Kingston HyperX Predator, 480 GB (PCIe 2.0 x4) | 307,47 |
| Toshiba Q300 Pro, 256 GB | 302,62 |
| Toshiba Q-Series Pro, 256 GB | 299,14 |
| Kingston HyperX Savage SSD, 480 GB | 298,61 |
| OCZ TR150, 480 GB | 298,27 |
| Toshiba Q300, 240 GB | 291,25 |
| OCZ Trion 100, 960 GB | 289,91 |
| Plextor M7V, 256 GB | 283,11 |
| Toshiba Q300 Pro, 128 GB | 277,86 |
| Plextor M6V, 256 GB | 272,96 |
| Angaben in MB/sec (mehr ist besser) | |
| Transferrate, Schreiben, Mittelwert | |
| Intel SSD 750 Series, 1.2 TB (PCIe 3.0 x4) | 1.131,36 |
| Kingston HyperX Savage SSD, 480 GB | 343,26 |
| OCZ Vector 180, 240 GB | 342,63 |
| Plextor M6e Black, 256 GB (PCIe 2.0 x2) | 331,44 |
| ZOTAC Premium SSD, 240 GB | 326,00 |
| Plextor M7V, 256 GB | 320,23 |
| Kingston HyperX Predator, 480 GB (PCIe 2.0 x4) | 318,83 |
| OCZ TR150, 480 GB | 297,01 |
| Plextor M6V, 256 GB | 287,03 |
| OCZ Trion 100, 960 GB | 266,39 |
| Toshiba Q300 Pro, 256 GB | 240,34 |
| Toshiba Q-Series Pro, 256 GB | 236,62 |
| Toshiba Q300 Pro, 128 GB | 206,48 |
| Toshiba Q300, 240 GB | 140,54 |
| Angaben in MB/sec (mehr ist besser) | |
| Zugriffe, Lesen, Mittelwert | |
| Intel SSD 750 Series, 1.2 TB (PCIe 3.0 x4) | 147.711 |
| ZOTAC Premium SSD, 240 GB | 88.161 |
| OCZ Vector 180, 240 GB | 83.950 |
| Plextor M6e Black, 256 GB (PCIe 2.0 x2) | 80.431 |
| Kingston HyperX Predator, 480 GB (PCIe 2.0 x4) | 78.711 |
| Toshiba Q300 Pro, 256 GB | 77.471 |
| Toshiba Q-Series Pro, 256 GB | 76.580 |
| Kingston HyperX Savage SSD, 480 GB | 76.444 |
| OCZ TR150, 480 GB | 76.356 |
| Toshiba Q300, 240 GB | 74.559 |
| OCZ Trion 100, 960 GB | 74.217 |
| Plextor M7V, 256 GB | 72.475 |
| Toshiba Q300 Pro, 128 GB | 71.131 |
| Plextor M6V, 256 GB | 69.878 |
| Angaben in IOPS (mehr ist besser) | |
| Zugriffe, Schreiben, Mittelwert | |
| Intel SSD 750 Series, 1.2 TB (PCIe 3.0 x4) | 289.628 |
| Kingston HyperX Savage SSD, 480 GB | 87.874 |
| OCZ Vector 180, 240 GB | 87.712 |
| Plextor M6e Black, 256 GB (PCIe 2.0 x2) | 84.848 |
| ZOTAC Premium SSD, 240 GB | 83.457 |
| Plextor M7V, 256 GB | 81.980 |
| Kingston HyperX Predator, 480 GB (PCIe 2.0 x4) | 81.621 |
| OCZ TR150, 480 GB | 76.035 |
| Plextor M6V, 256 GB | 73.480 |
| OCZ Trion 100, 960 GB | 68.195 |
| Toshiba Q300 Pro, 256 GB | 61.527 |
| Toshiba Q-Series Pro, 256 GB | 60.575 |
| Toshiba Q300 Pro, 128 GB | 52.859 |
| Toshiba Q300, 240 GB | 35.979 |
| Angaben in IOPS (mehr ist besser) | |
Fühlen Sie sich sicher in Ihrem Zuhause? Mehr als jede vierte Person in Deutschland (28,6 %) gab laut der SKiD-Dunkelfeldstudie...
Für viele Freizeitläuferinnen und -läufer ist nicht das Training selbst die größte organisatorische Herausforderung. Schwieriger ist der Übergang zwischen Arbeit,...
ASUS bringt die Creator-Laptops ProArt P14 (H7407) und P16 (H7607) mit Nvidia RTX Spark ab sofort in Deutschland auf den...
ASUS Republic of Gamers (ROG) startet den Verkauf des ROG Xbox Ally X20. Der Gaming-Handheld kombiniert ein durchscheinendes schwarzes Gehäuse...
Mit dem AGON PRO AG326UZD2 bringt AOC einen Gaming-Monitor auf den Markt, der anspruchsvolle Spieler mit einer Kombination aus hoher...
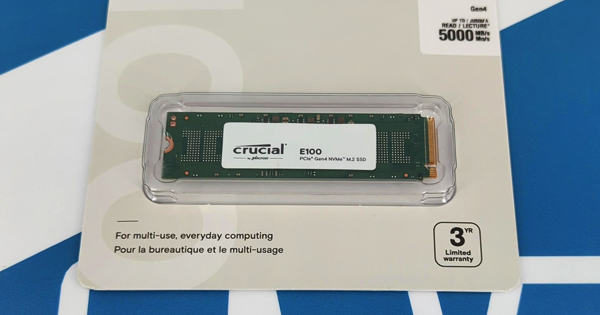
Die E100-SSD von Crucial basiert auf einem PCIe Gen4 Interface und QLC-Flashspeicher von Micron. Die Serie zielt auf Ein- und Umsteiger in die SSD-Welt ab. Wir haben uns das 1-TB-Modell im Test angesehen.
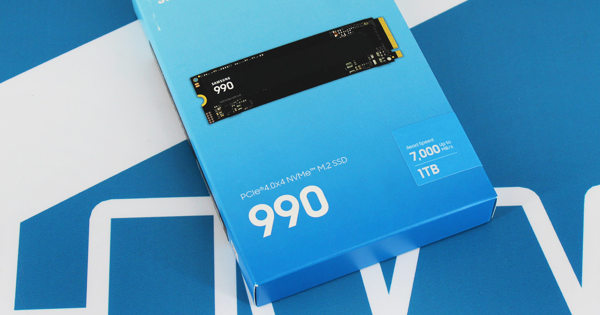
Mit der SSD-990-Familie stellt Samsung eine neue Serie von SSDs für Einsteiger vor. Wie sich die Kombination aus PCI Express Gen4 und QLC-Flashspeicher in der Praxis schlägt, klären wir am 1-TB-Modell.
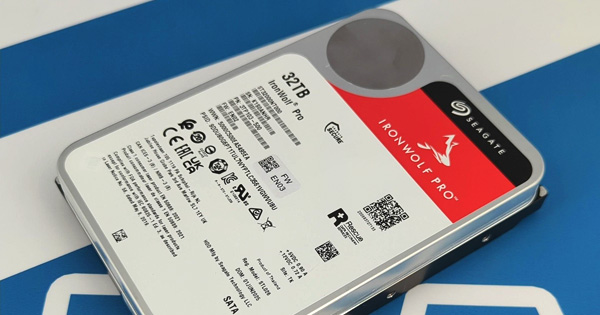
Die Familie der IronWolf Pro Festplatten von Hersteller Seagate adressiert vor allem NAS-Systeme im Profi-Segment. Wir haben uns das aktuelle Flaggschiff der CMR-Plattform mit satten 32 TB im Praxistest zur Brust genommen.