
Die vier synthetischen Tests des AS SSD-Benchmarks ermitteln die sequentielle und zufällige Lese- und Schreibgeschwindigkeit unserer Testprobanden. Diese Tests werden ohne Nutzung des Betriebssystem-Caches durchgeführt. In den sequentiellen Tests misst das Programm wie lange es dauert, eine 1 GB große Datei zu lesen respektive zu schreiben. Im 4K-Test wird die Lese- und Schreibleistung bei zufällig ausgewählten 4K-Blöcken ermittelt. Der 4K-64-Thrd-Test entspricht dem 4K-Prozedere, nur dass in diesem Fall die Lese-und Schreiboperationen auf 64 Threads verteilt sind. Damit wird der typische Start eines Programms bzw. Prozesses simuliert.
Zuletzt wird noch die Zugriffszeit der SSD ermittelt, wobei der Zugriff beim Lesen über die gesamte Kapazität der SSD (Fullstroke) ermittelt wird. Der Schreibzugriffstest erfolgt mit einer 1 GB-Testdatei.
| read, Mittelwert | |
| Plextor M5S, 256 GB | 522,59 |
| ADATA XPG SX900, 256 GB | 517,45 |
| OCZ Vector 150, 120 GB | 515,75 |
| Plextor M5 Pro Xtreme, 128 GB | 514,33 |
| OCZ Vector 150, 480 GB | 513,37 |
| Samsung SSD 840 EVO, 1 TB | 512,54 |
| Plextor M5 Pro Xtreme, 256 GB | 507,49 |
| OCZ Vertex 460, 480 GB | 504,75 |
| OCZ Vertex 460, 240 GB | 504,34 |
| Crucial M500 SSD, 480 GB | 498,30 |
| Intel SSD 335 Series, 240 GB | 496,66 |
| Plextor M6S, 256 GB | 488,22 |
| Kingston HyperX 3K SSD, 120 GB | 451,62 |
| OCZ ARC 100, 240 GB | 442,51 |
| ADATA Premier Pro SP900, 256 GB | 403,74 |
| Kingston SSDNow V300, 120 GB | 176,63 |
| Angaben in MB/sec (mehr ist besser) | |
| write, Mittelwert | |
| Samsung SSD 840 EVO, 1 TB | 498,15 |
| OCZ Vector 150, 480 GB | 497,27 |
| OCZ Vertex 460, 240 GB | 497,05 |
| OCZ Vertex 460, 480 GB | 494,79 |
| Plextor M6S, 256 GB | 437,05 |
| Plextor M5 Pro Xtreme, 256 GB | 435,01 |
| Crucial M500 SSD, 480 GB | 424,91 |
| OCZ Vector 150, 120 GB | 412,84 |
| OCZ ARC 100, 240 GB | 410,77 |
| Plextor M5S, 256 GB | 378,90 |
| ADATA Premier Pro SP900, 256 GB | 355,60 |
| Intel SSD 335 Series, 240 GB | 312,67 |
| ADATA XPG SX900, 256 GB | 310,99 |
| Plextor M5 Pro Xtreme, 128 GB | 303,84 |
| Kingston HyperX 3K SSD, 120 GB | 236,80 |
| Kingston SSDNow V300, 120 GB | 133,43 |
| Angaben in MB/sec (mehr ist besser) | |
| read, Mittelwert | |
| Samsung SSD 840 EVO, 1 TB | 36,28 |
| Plextor M5 Pro Xtreme, 128 GB | 30,30 |
| Plextor M5 Pro Xtreme, 256 GB | 29,94 |
| Plextor M6S, 256 GB | 29,89 |
| Plextor M5S, 256 GB | 28,74 |
| OCZ Vector 150, 480 GB | 26,92 |
| OCZ Vertex 460, 480 GB | 26,78 |
| OCZ ARC 100, 240 GB | 24,87 |
| Crucial M500 SSD, 480 GB | 24,58 |
| OCZ Vector 150, 120 GB | 23,37 |
| OCZ Vertex 460, 240 GB | 22,82 |
| Intel SSD 335 Series, 240 GB | 22,51 |
| ADATA Premier Pro SP900, 256 GB | 20,99 |
| ADATA XPG SX900, 256 GB | 19,74 |
| Kingston HyperX 3K SSD, 120 GB | 19,24 |
| Kingston SSDNow V300, 120 GB | 15,78 |
| Angaben in MB/sec (mehr ist besser) | |
| write, Mittelwert | |
| OCZ Vertex 460, 240 GB | 77,63 |
| Samsung SSD 840 EVO, 1 TB | 74,25 |
| OCZ Vector 150, 120 GB | 72,60 |
| Crucial M500 SSD, 480 GB | 72,39 |
| ADATA Premier Pro SP900, 256 GB | 71,56 |
| Intel SSD 335 Series, 240 GB | 70,46 |
| Kingston SSDNow V300, 120 GB | 69,36 |
| OCZ Vector 150, 480 GB | 68,20 |
| Kingston HyperX 3K SSD, 120 GB | 67,64 |
| OCZ Vertex 460, 480 GB | 67,34 |
| Plextor M5 Pro Xtreme, 256 GB | 65,23 |
| Plextor M6S, 256 GB | 64,67 |
| Plextor M5 Pro Xtreme, 128 GB | 64,45 |
| OCZ ARC 100, 240 GB | 63,53 |
| Plextor M5S, 256 GB | 59,29 |
| ADATA XPG SX900, 256 GB | 56,26 |
| Angaben in MB/sec (mehr ist besser) | |
| read, Mittelwert | |
| Samsung SSD 840 EVO, 1 TB | 371,64 |
| Plextor M5 Pro Xtreme, 256 GB | 367,00 |
| OCZ Vector 150, 480 GB | 353,96 |
| Plextor M6S, 256 GB | 353,72 |
| OCZ Vertex 460, 480 GB | 345,43 |
| Plextor M5 Pro Xtreme, 128 GB | 344,82 |
| Crucial M500 SSD, 480 GB | 334,29 |
| OCZ Vertex 460, 240 GB | 318,44 |
| OCZ ARC 100, 240 GB | 306,57 |
| OCZ Vector 150, 120 GB | 304,30 |
| Plextor M5S, 256 GB | 279,70 |
| ADATA Premier Pro SP900, 256 GB | 235,00 |
| Intel SSD 335 Series, 240 GB | 204,39 |
| ADATA XPG SX900, 256 GB | 194,49 |
| Kingston HyperX 3K SSD, 120 GB | 137,54 |
| Kingston SSDNow V300, 120 GB | 81,28 |
| Angaben in MB/sec (mehr ist besser) | |
| write, Mittelwert | |
| Samsung SSD 840 EVO, 1 TB | 287,85 |
| Plextor M5 Pro Xtreme, 256 GB | 282,44 |
| Plextor M6S, 256 GB | 275,21 |
| OCZ Vector 150, 480 GB | 270,38 |
| Crucial M500 SSD, 480 GB | 267,18 |
| OCZ Vertex 460, 480 GB | 264,27 |
| OCZ Vertex 460, 240 GB | 264,13 |
| OCZ Vector 150, 120 GB | 259,67 |
| OCZ ARC 100, 240 GB | 256,76 |
| Plextor M5S, 256 GB | 256,72 |
| Plextor M5 Pro Xtreme, 128 GB | 250,21 |
| Intel SSD 335 Series, 240 GB | 220,48 |
| ADATA XPG SX900, 256 GB | 206,03 |
| ADATA Premier Pro SP900, 256 GB | 204,60 |
| Kingston HyperX 3K SSD, 120 GB | 189,05 |
| Kingston SSDNow V300, 120 GB | 122,82 |
| Angaben in MB/sec (mehr ist besser) | |
| read, Mittelwert | |
| Crucial M500 SSD, 480 GB | 0,05 |
| OCZ Vector 150, 120 GB | 0,05 |
| OCZ Vertex 460, 240 GB | 0,05 |
| Plextor M5 Pro Xtreme, 128 GB | 0,05 |
| Plextor M5 Pro Xtreme, 256 GB | 0,05 |
| Plextor M6S, 256 GB | 0,05 |
| Samsung SSD 840 EVO, 1 TB | 0,05 |
| OCZ ARC 100, 240 GB | 0,06 |
| Plextor M5S, 256 GB | 0,06 |
| OCZ Vertex 460, 480 GB | 0,07 |
| OCZ Vector 150, 480 GB | 0,08 |
| ADATA Premier Pro SP900, 256 GB | 0,11 |
| Intel SSD 335 Series, 240 GB | 0,14 |
| Kingston HyperX 3K SSD, 120 GB | 0,16 |
| ADATA XPG SX900, 256 GB | 0,20 |
| Kingston SSDNow V300, 120 GB | 0,20 |
| Angaben in Millisekunden (weniger ist besser) | |
| write, Mittelwert | |
| OCZ ARC 100, 240 GB | 0,05 |
| OCZ Vector 150, 120 GB | 0,05 |
| OCZ Vector 150, 480 GB | 0,05 |
| OCZ Vertex 460, 240 GB | 0,05 |
| OCZ Vertex 460, 480 GB | 0,05 |
| Samsung SSD 840 EVO, 1 TB | 0,05 |
| Crucial M500 SSD, 480 GB | 0,06 |
| Plextor M5 Pro Xtreme, 128 GB | 0,06 |
| Plextor M5 Pro Xtreme, 256 GB | 0,06 |
| Plextor M6S, 256 GB | 0,06 |
| Plextor M5S, 256 GB | 0,07 |
| ADATA Premier Pro SP900, 256 GB | 0,20 |
| Intel SSD 335 Series, 240 GB | 0,21 |
| ADATA XPG SX900, 256 GB | 0,22 |
| Kingston HyperX 3K SSD, 120 GB | 0,24 |
| Kingston SSDNow V300, 120 GB | 0,31 |
| Angaben in Millisekunden (weniger ist besser) | |
Mit dem AGON PRO AG326UZD2 bringt AOC einen Gaming-Monitor auf den Markt, der anspruchsvolle Spieler mit einer Kombination aus hoher...
SanDisk erweitert sein Speicherportfolio um die Guardian Series, die speziell für Kameras mit kontinuierlicher Aufzeichnung entwickelt wurde. Die neuen Speicherkarten...
KIOXIA hat mit der LD4-Serie seine ersten SSDs im E1.L-Formfaktor auf Basis der achten Generation des BiCS FLASH QLC vorgestellt....
devolo bringt mit dem WiFi 7 BE9300 einen neuen Tri-Band-Router auf den Markt, der sich als Ethernet-Router für Glasfaseranschlüsse, Access...
BenQ erweitert seine MOBIUZ-Serie um den EX271QMZ. Der 26,5 Zoll große Gaming-Monitor setzt auf ein QD-OLED-Panel der dritten Generation mit...
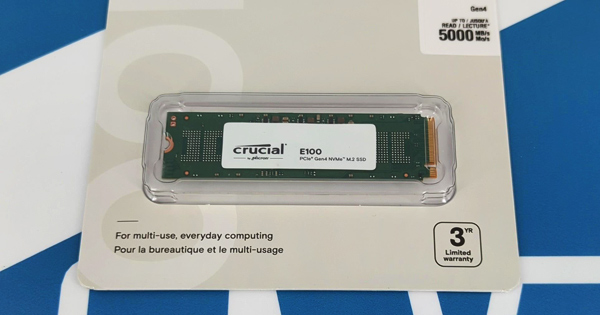
Die E100-SSD von Crucial basiert auf einem PCIe Gen4 Interface und QLC-Flashspeicher von Micron. Die Serie zielt auf Ein- und Umsteiger in die SSD-Welt ab. Wir haben uns das 1-TB-Modell im Test angesehen.
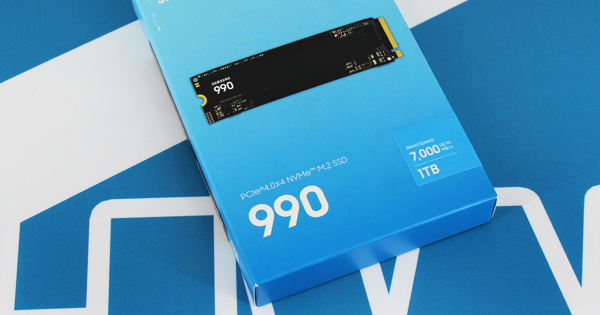
Mit der SSD-990-Familie stellt Samsung eine neue Serie von SSDs für Einsteiger vor. Wie sich die Kombination aus PCI Express Gen4 und QLC-Flashspeicher in der Praxis schlägt, klären wir am 1-TB-Modell.
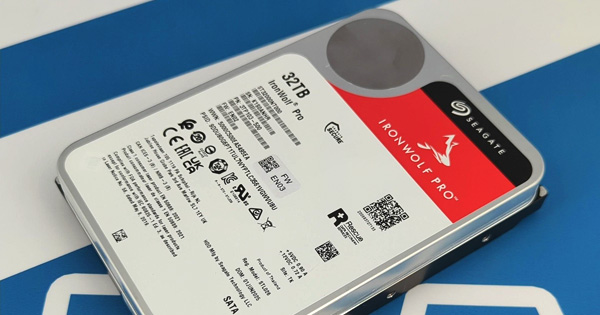
Die Familie der IronWolf Pro Festplatten von Hersteller Seagate adressiert vor allem NAS-Systeme im Profi-Segment. Wir haben uns das aktuelle Flaggschiff der CMR-Plattform mit satten 32 TB im Praxistest zur Brust genommen.